 PLATE + FIT
How much bigger is a restaurant meal today than one from 1980? A lot bigger — and the shift happened slowly enough that most people never noticed the plate creeping outward. This is the story of how portion sizes have grown since 1980, told through the foods that changed the most: the bagel that doubled in diameter, the soda that nearly tripled in volume, the fries that gained 400 calories without ever feeling like « more. » You’ll see the actual numbers from the public-health and packaging data that tracked this shift as it happened, not vague impressions. You’ll also see why it happened — packaging economics, restaurant pricing, and the slow normalization of « large » as the default — and what you can actually do about it today, without counting a single calorie.
What « Portion Distortion » Really Means
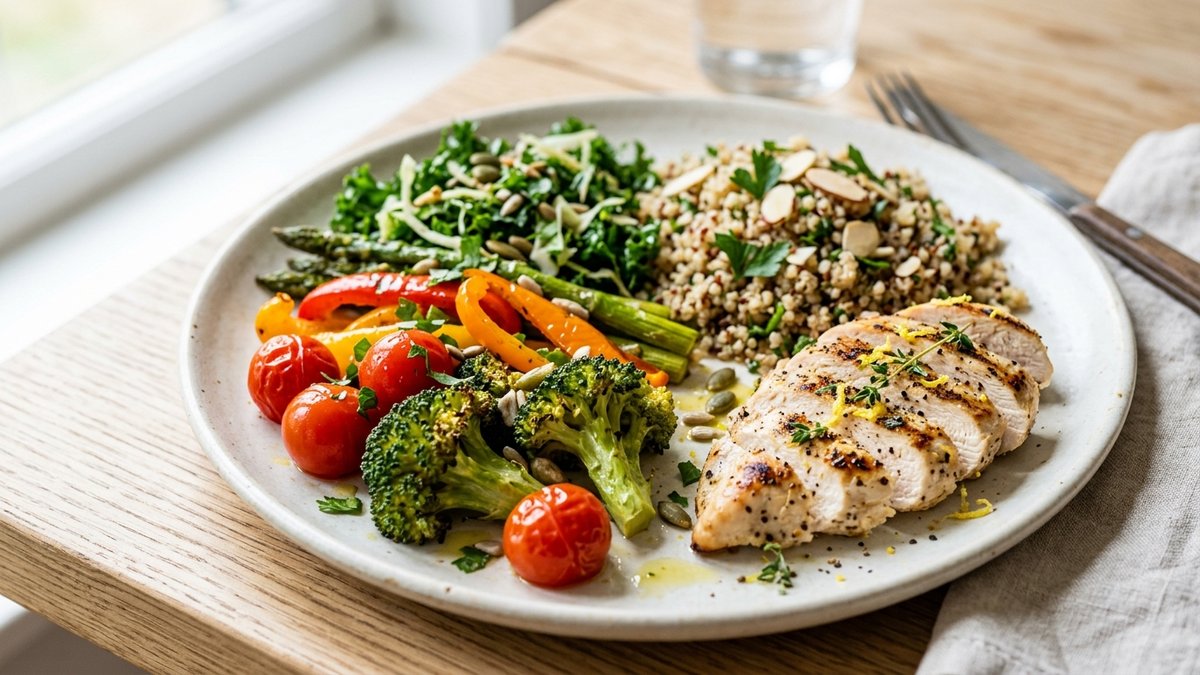
Nutrition researchers gave this shift a name in the early 2000s: portion distortion — the gradual, mostly invisible growth of « normal » serving sizes for the same food, to the point that yesterday’s large is today’s small. The National Heart, Lung, and Blood Institute (NHLBI) documented it item by item, comparing what a food looked like in the 1980s and 90s against what the same item looks like now.
The bagel is the clearest example. Twenty years ago, a standard bagel measured about 3 inches across and carried roughly 140 calories. Today’s bagel averages 6 inches across — double the diameter — and about 350 calories, 2.5 times as much. A cheeseburger followed a similar curve: 333 calories in the 1980s baseline versus 590 calories for a typical cheeseburger today, a jump of 77%.
None of this happened because a chef decided to double the size overnight. It happened one menu redesign, one bulk-packaging decision, one « why not upsize it » prompt at a time, spread across four decades. That is how portion sizes have grown since 1980 — not as a single event, but as a thousand small increments that each felt negligible.
The scale of the shift matters because your body doesn’t recalibrate « normal » on its own. Whatever size shows up on the plate in front of you becomes the reference point, whether it’s 140 calories or 350. If you want a full method for resetting that reference point without tracking anything, the healthy eating plate approach rebuilds it visually instead of numerically.
Then and Now: How Much Bigger the Everyday Plate Got

Soda is the clearest packaging story, because it’s told entirely through container sizes. Coca-Cola sold nothing but the 6.5-ounce contour bottle from 1916 until 1955, when the 10- and 12-ounce « King Size » and 26-ounce « Family Size » bottles launched. The 12-ounce can arrived in 1960. The 20-ounce plastic bottle — now the default single-serve size at a convenience-store register — didn’t exist until 1993. A 6.5-ounce soda holds about 85 calories; the 20-ounce version most people now grab without thinking holds 250.
The same growth curve shows up across the rest of the plate, tracked then-vs-now by the NHLBI’s Portion Distortion research:
- French fries: 2.4 oz and 210 calories then, 6.9 oz and 610 calories now
- Movie popcorn: 5 cups and 270 calories then, 11 cups and 630 calories now
- Spaghetti with meatballs: 1 cup pasta with 3 small meatballs (500 calories) then, 2 cups with 3 large meatballs (1,025 calories) now
- Muffins: 1.5 oz and 210 calories then, 4 oz and 500 calories now
- Cheeseburgers: 333 calories then, 590 calories now
The downstream numbers track the same slope. U.S. adult obesity prevalence sat near 15% from 1976 to 1980, then climbed to 34% by 2007–2008 — more than double in three decades, with the steepest rise starting in the early 1980s. USDA food-availability data tells a parallel story: the average calories available per person per day rose by roughly 23% between 1970 and 2010. Bigger portions didn’t cause all of that gap on their own, but they were consistently one of the largest, most measurable contributors researchers could point to.
How to Right-Size Your Plate Without Counting Anything
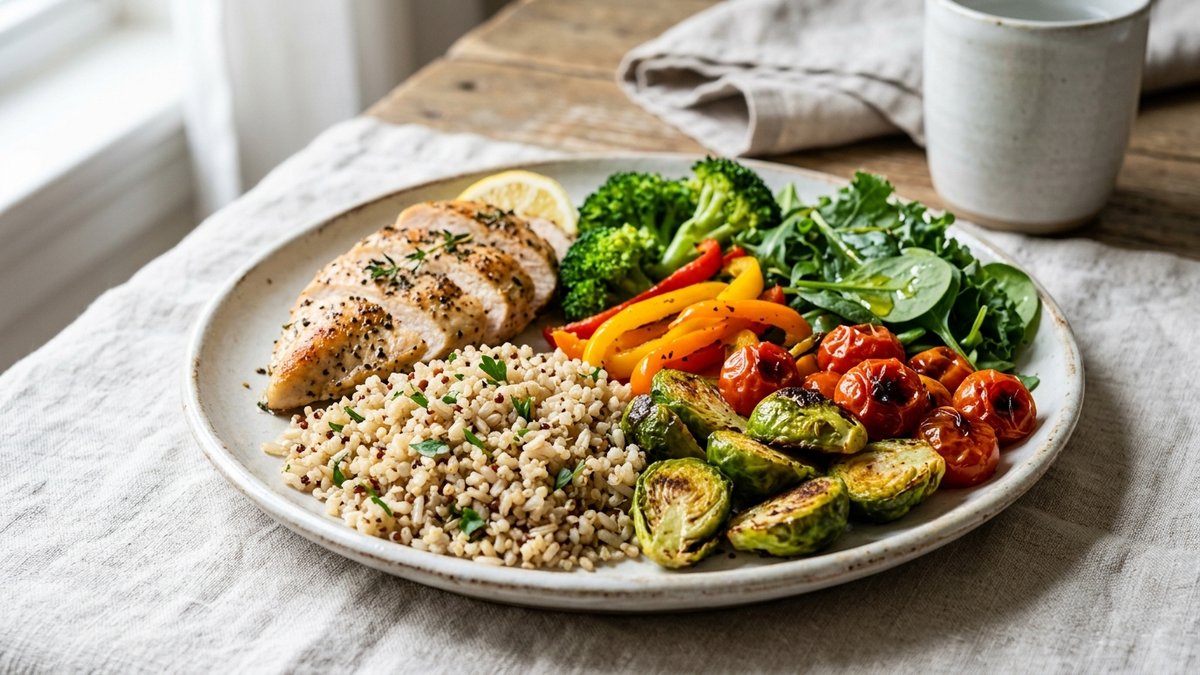
You don’t need to memorize the 1980s baseline for every food to benefit from it. A few visual anchors do most of the work:
- Use your palm and fist as reference points. A palm-sized portion of protein (about 3-4 oz for most adults) and a fist-sized portion of starchy carbs get you close to pre-distortion portions without a scale. The full breakdown is in the hand portion method guide.
- Default to the smaller size when two are offered. If a bagel shop offers a « mini » and a « regular, » the mini is closer to the 1980s standard than the regular is.
- Pour, don’t sip from the bottle. A 20-ounce soda poured into a glass is easier to stop partway through than one drunk straight from the container — you can see, and choose to leave, the last third.
- Split the fries or popcorn before you start. Moving half a large order onto a napkin or a second bowl before the first bite works better than « just eating slower, » because it removes the decision at every later bite instead of relying on willpower at each one.
- Build the rest of the plate around a fixed proportion, not a fixed food. Half vegetables, a quarter protein, a quarter whole grains holds steady regardless of how large or small the serving dish is — which is the entire logic behind the 50/25/25 plate method in the first place.
None of this requires tracking, weighing, or giving up any food outright. It works because it changes the reference point back toward what « normal » looked like before packaging and menus quietly moved it — skipping a 20-ounce soda for a 12-ounce can doesn’t take willpower the way skipping dessert does, it just takes noticing that « the default » and « a portion » stopped being the same thing sometime in the last 40 years.
Where the Portion Plate Fits
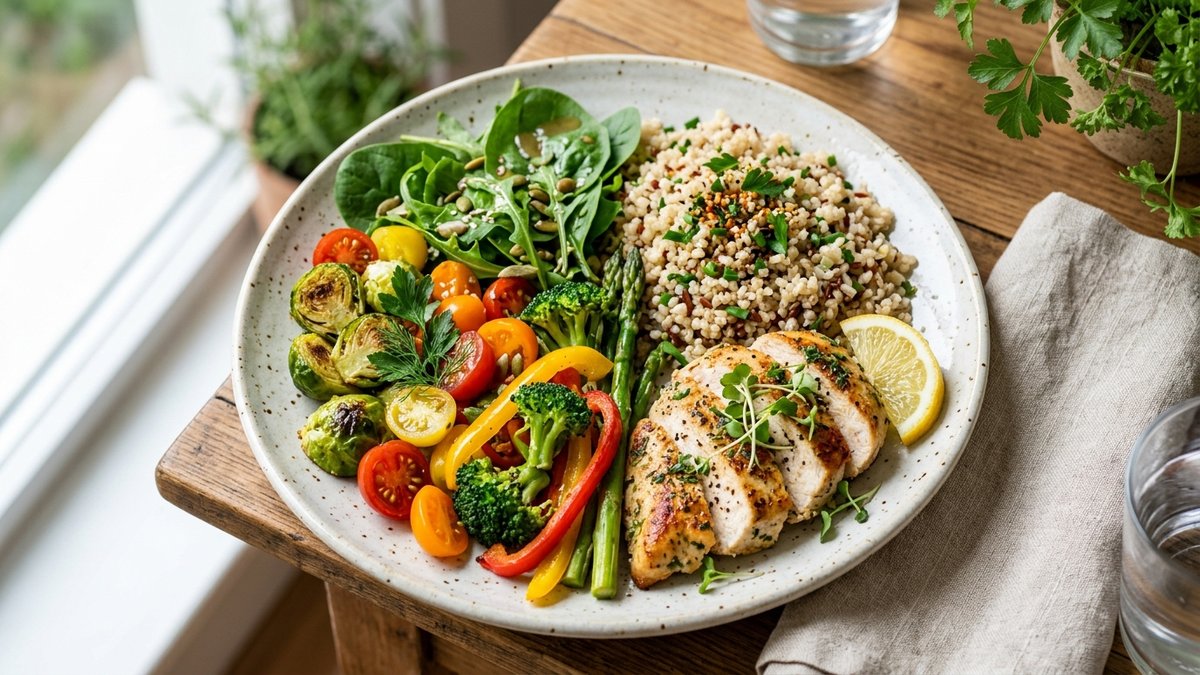
Every fix in the section above works by restoring an external reference point — a fist, a palm, a smaller cup — because your eyes and stomach adapted to 40 years of creeping « normal, » not because anything is wrong with your appetite. A portion-control plate does the same job for the plate itself: the divisions are fixed at roughly the proportions the NHLBI and USDA data above describe as the pre-distortion baseline — about half the plate for vegetables, a quarter for protein, a quarter for whole grains or starch — so the plate does the calibrating instead of you having to remember it at every meal.
It’s not a diet and it doesn’t ban any food; a 6-inch bagel or a 20-ounce soda still fit fine next to it, they just stop being the invisible default. Think of it as the low-effort version of the « use a reference point » habit above — one you don’t have to actively practice, because the object in front of you already carries the right proportions.
FAQ
When did portion sizes in the U.S. start growing?
The clearest jump began in the early 1980s and continued through the 1990s and 2000s. Adult obesity prevalence, one of the most tracked downstream measures, sat near 15% from 1976 to 1980 and had risen to 34% by 2007–2008 — the steepest part of that curve starts almost exactly when portion sizes for foods like bagels, sodas, and fries began climbing in NHLBI’s tracking.
Why did portions get bigger starting in the 1980s?
A mix of packaging economics and restaurant pricing: bulk ingredients are cheap relative to labor and rent, so a larger fries order or soda costs a restaurant only a few cents more to make but can be sold at a meaningfully higher markup. As larger sizes became more profitable to offer, and few customers turned them down, the small size quietly stopped being the default.
Does eating from a smaller plate actually reduce how much you eat?
Some early, widely cited research specifically on plate size and consumption was later retracted for data integrity problems, so treat strong claims about plate diameter alone with caution. What’s better supported is portion-size research more broadly: when the amount of food served goes up, people reliably eat more of it, largely without noticing — which is the mechanism behind the 1980s-to-today comparisons above.
What’s a realistic portion of protein or carbs compared to the 1980s?
Public-health guidance from that era generally described a protein portion as about 3 ounces — roughly a deck of cards or a palm — and a starch portion as about half a cup to a cup, closer to a fist. Today’s default restaurant and packaged portions typically run 1.5 to 3 times larger than those reference points.
Is portion distortion mostly a U.S. pattern, or does it show up elsewhere?
The clearest documented cases — the bagel, the soda, the movie popcorn — are American, tracked through U.S. restaurant and packaging data. Similar growth in packaged serving sizes has been observed in other markets with comparable fast-food and packaged-snack industries, though the scale and starting point differ by country and aren’t captured in the same side-by-side comparisons used here.
Key Takeaways
- Bagels doubled in size and 2.5x the calories since the 1980s
- Soda grew from a 6.5 oz bottle (1916) to 20 oz (1993)
- Fries, popcorn, and pasta portions roughly doubled since the 1980s
- U.S. adult obesity rose from 15% to 34% in three decades
- Daily calorie availability per person rose about 23% since 1970
- A fixed-proportion plate resets your baseline without tracking anything
Forty years of creeping portions didn’t happen because anyone’s appetite changed — the reference point did. See the portion-control plate that puts the pre-1980s proportions back on the table, no counting required.